Your cash flow data finally speaks for itself

Do you spend hours reformatting your exports to create a clear cash flow report? Fygr transforms your tracking data into charts, metrics, and exports that are ready to share.
+ 3,000 companies supported in their cash management
selency logo

Why choose Fygr to visualize your financial data?

icon comments

Filter by category

Distribution charts for the time period of your choice. Compare two date ranges to identify trends.
light icon

Track your KPIs

Customizable metrics (balance, burn rate, runway, etc.) with alert thresholds, continuously updated with your data.
receive icon

Export without re-entering

Export your spreadsheet with a single click to edit your data in Excel or integrate it into your existing reports.
Zoom in on the graphics functionality of Fygr, cash management and forecasting software for small businesses, SMEs and startups.

See where your money is going, period by period

Breakdown charts break down your cash inflows and outflows by category over the date range of your choice. You can filter by category, adjust the time period, and compare two ranges side by side to identify trends. No need to create a chart in Excel to understand why your cash flow changed this quarter—the answer is visual and immediate.

Create a dashboard with your key metrics

Create your own metrics using all the data stored in Fygr: balance, burn rate, runway, and changes over a given period. You define what to track, set alert thresholds, and get a dashboard tailored to what your stakeholders need. Metrics update automatically and in real time.
Custom metrics in the Fygr app
Visual representation of cash management in an Excel file

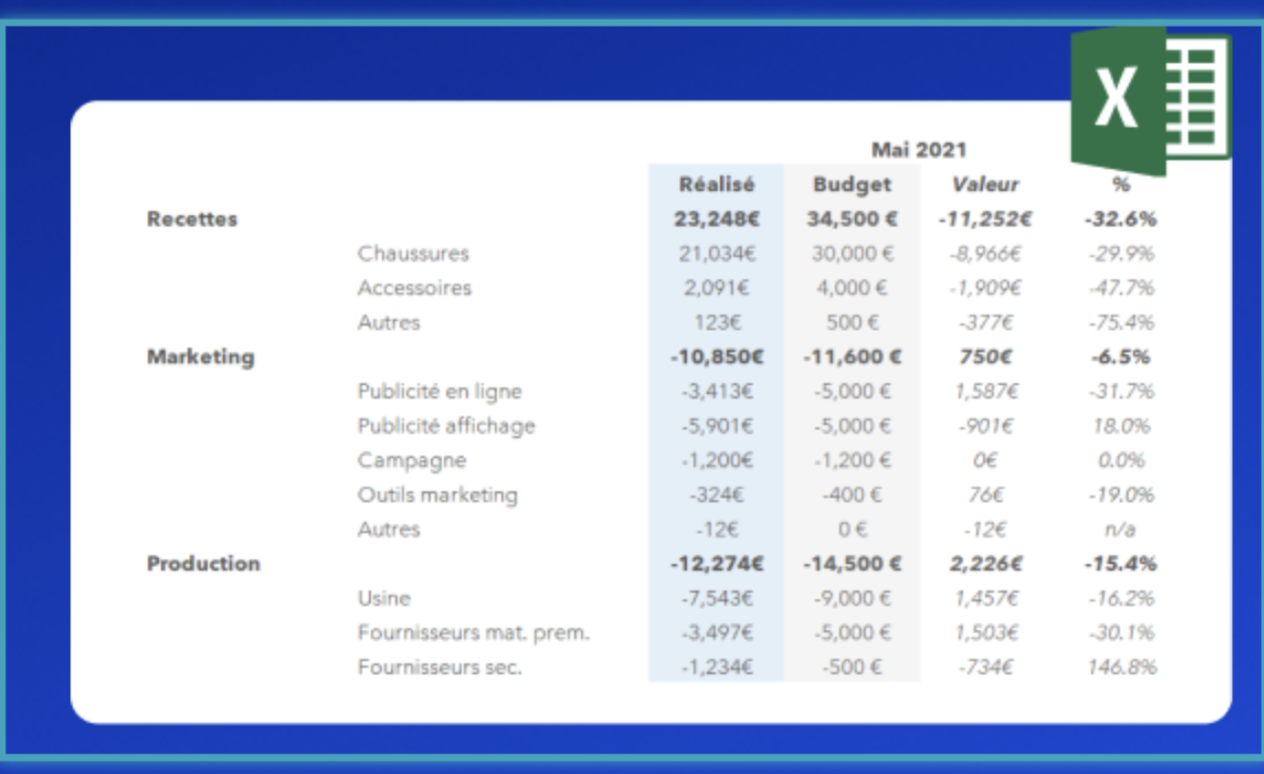
Export the data to perform your own analyses

The spreadsheet export feature gives you access to your structured, up-to-date data, ready to be integrated into your Excel models or internal reports. You retrieve reliable data without having to re-enter it, and you can freely customize it: create your own charts, perform your own cross-tabulations, and apply your own formatting. Fygr data isn’t locked away in the tool—it powers the rest of your finance workflow.

Like them, more than 1,000 executives and financial experts visualize their financial data with Fygr

Here's what some of our customers have to say after choosing Fygr to visualize their financial data:
"Before, we didn't have a clear vision... Today, Fygr allows us to see where the company's expense items are."‍
profile photo of Collins Njiakin
Collins Njiakin
Co-founder, Wacols
"When I log on, everything is already up to date, I know where I stand, that's really great."‍
Profile picture Titouan Parand
Titouan Parand
Co-founder, X-Tract
"Fygr really gives me a concrete view of everything that's going on in my company in terms of financial flows."‍
Profile photo: Mariya VASYUK
Mariya Vasyuk
Founder, Colibrity
"We create events in just a few clicks, and we get the forecast directly, and comparisons with other scenarios: it's both hyper-simple and hyper-flexible."
Profile photo of Thomas Saoud
Thomas Sadoul
Co-founder of Cocoon-Immo
"Above all, it's a visual layer that makes it easier to read the figures, and also enables us to collaborate better, particularly with our investors."‍
Thomas Reynaud
CEO, Garantme

You're just a few minutes away from a reliable financial forecast

Invest 1 hour today, save 3 hours a week tomorrow, and put an end to forecasting errors.
7-day free trial - No commitment